Analysis Dashboard
myGEKKO
Description
No DDF available
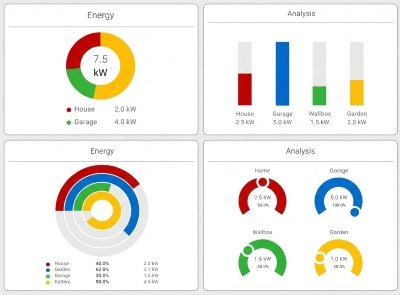
Analysis Dashboard
This DDF provides a comprehensive selection of pre-built SVG visualization widgets for the Analysis system, optimizing the graphical representation of measured values.
It is divided into summary displays for totals and proportions, as well as individual displays for detailed single values.
The key benefits include standardized presentation, automatic scaling of raw data based on min and max limits, and flexible choices among the following chart types for optimal consumption monitoring:
- Donuts: As summary, individual, or nested views.
- Gauges: As modern ring tachometers or classic pointer gauges.
- Bars: Horizontal for linear comparisons and fill levels.
- Columns: Vertical as stacked sums or individual values with maximum frames.
General Info
| Manufacturer | Type | Protocol | Model | Version | ID |
|---|---|---|---|---|---|
| myGEKKO | Graphical user interface | SVG (DDF) | 1 | 1 | 0x1100000100010100 |